

Markets extended the losing streak for the fourth consecutive week, falling nearly 3% on strong FII outflows and subdued Q2 earnings. The NIFTY50 index closed below the September low and extended the weakness to the 24,000 level. However, it protected the psychological level on a closing basis to end the week at 24,180.
It was a broad-based sell-off across all sectors with Metals (-7.2%), Real-Estate (-6.9%) and Oil & Gas (-6.2%) being the biggest losers. In addition, the broader markets also came under selling pressure and formed large bearish candles on the weekly chart. The NIFTY Midcap 100 index fell 5.7%, while the NIFTY Smallcap 100 index slumped 6.4%.
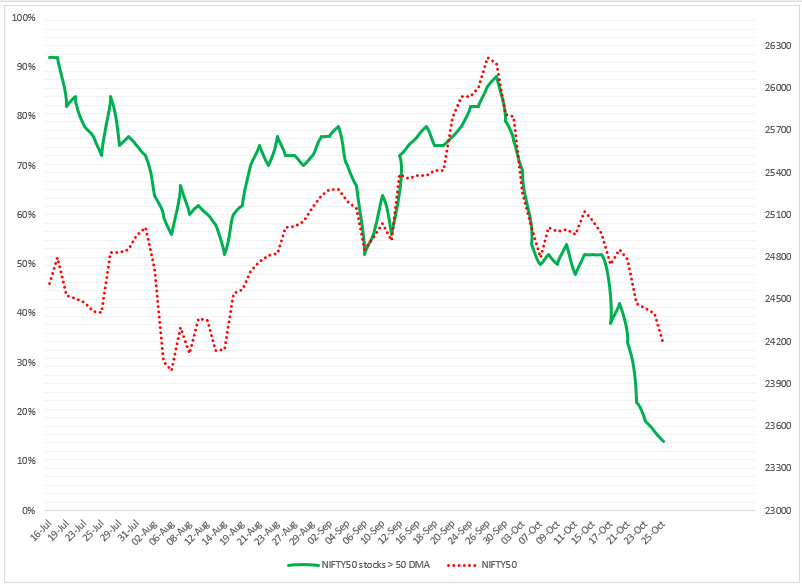
Index breadth- NIFTY50
The index breadth continued to weaken, with only 14% of NIFTY50 stocks trading above their 50-day moving average, signaling entry into the short-term oversold zone. This confirms the index’s bearish momentum, as the breadth indicator dropped from last week’s 34% to end the week at 14%. While the overall trend remains negative, the oversold conditions in the near term suggest a potential for a short-term bounce.
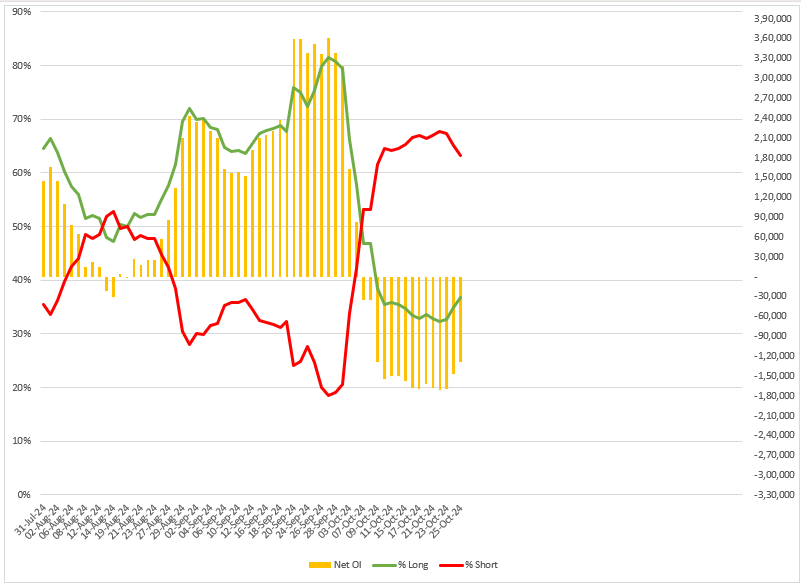
FIIs positioning in the index
The Foreign Insititutional Investors(FIIs) gradually reduced their short positions in the index futures over the past week, lowering the net open interest from -1.67 lakh contracts at the start of the week to -1.29 lakh contracts. By Friday, the FIIs’ long-to-short ratio in index futures had improved to 37:63, up from 33:67 the previous week.
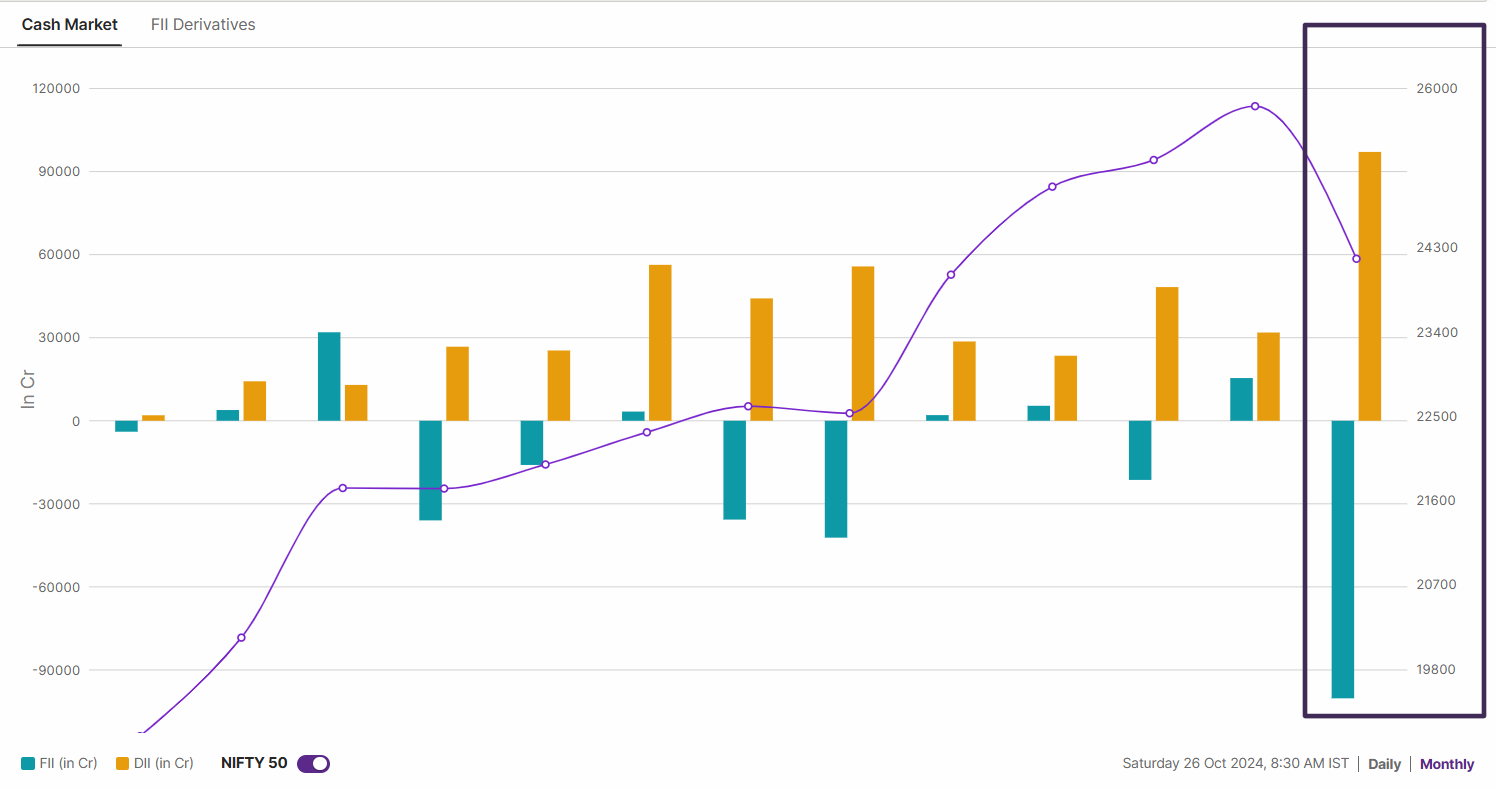
However, the broader trend for FIIs remains negative, as evidenced by their cash market activity. In October 2024, foreign investors offloaded shares worth ₹1 lakh crore, marking the highest monthly sell-off. Conversely, the Domestic Institutional Investors absorbed the selling pressure and purchased shares worth ₹97,000 crore, resulting in a net outflow of ₹3,000 crore.
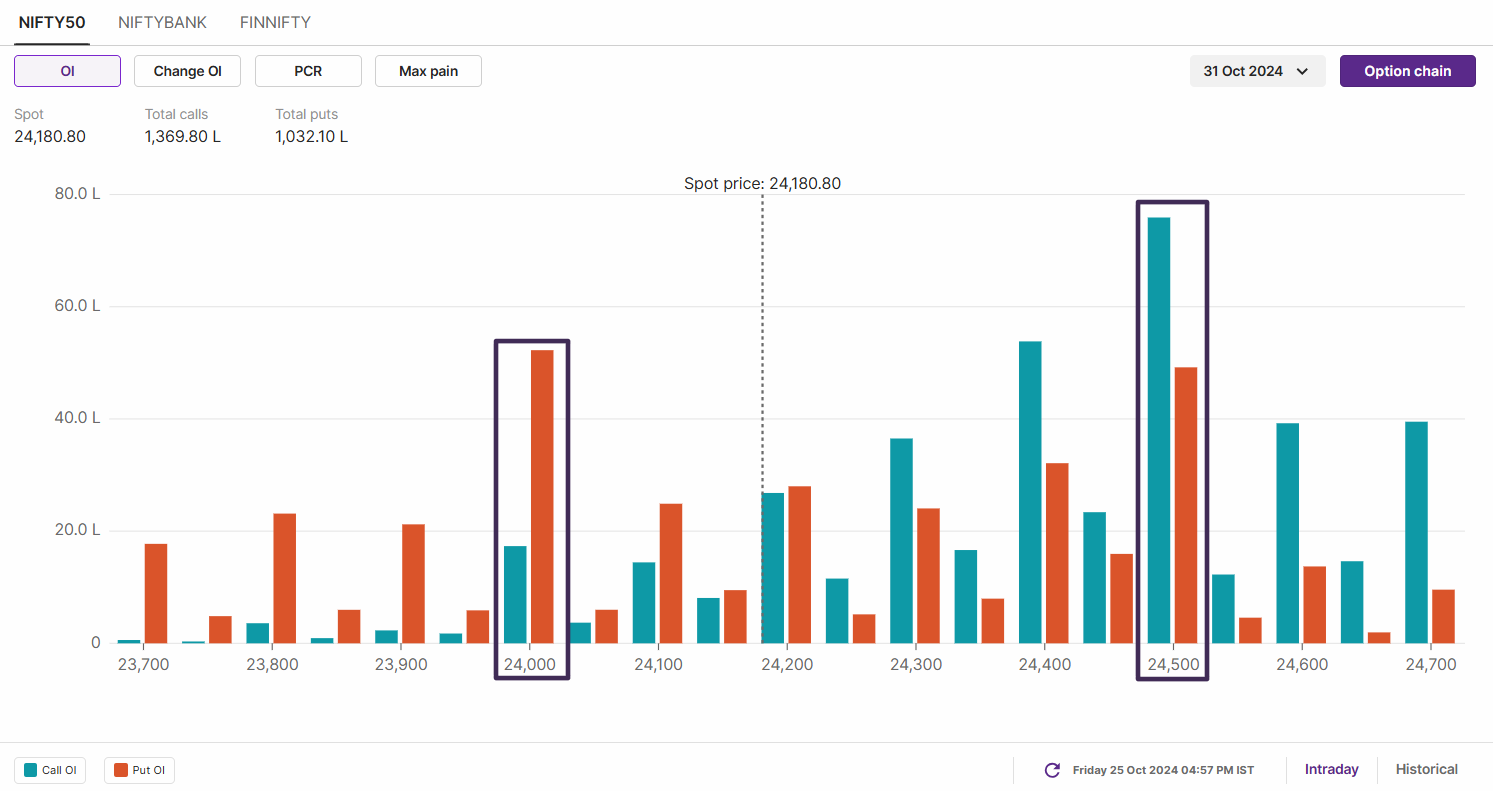
F&O – NIFTY50 outlook
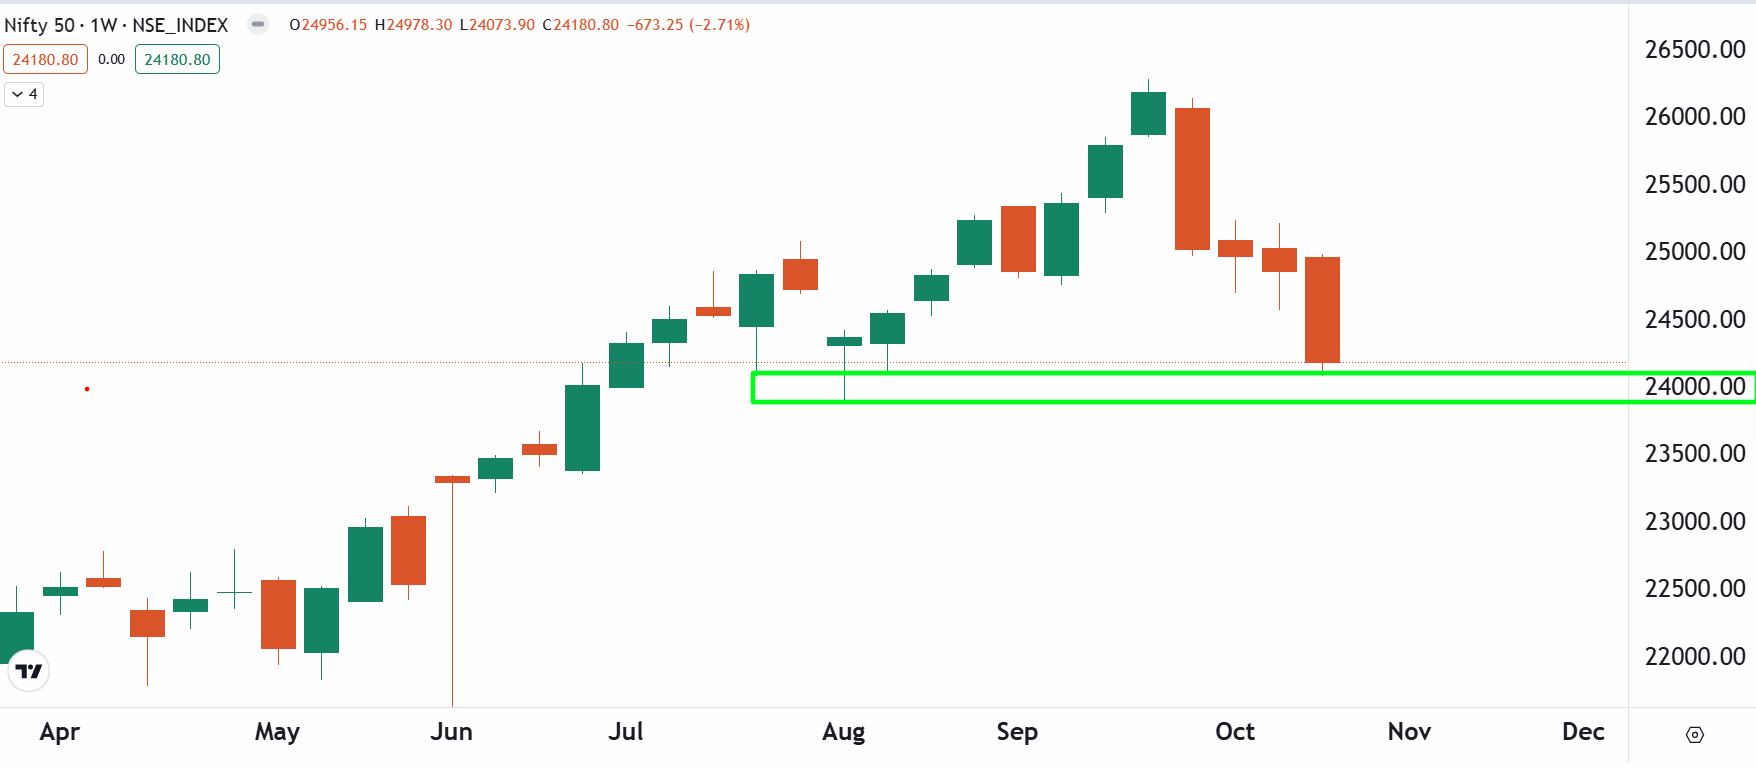
The positioning of open interest of the NIFTY50’s monthly expiry is establishing range-bound activity. The index has highest call open interest at 24,500 strike, suggesting resistance for the index around this level. On the flip side, the put base was seen at 24,000 strike, pointing at support around this zone for the index.
The price action of NIFTY50 as per the weekly time frame remained bearish and has now entered the immediate support zone of 23,900 and 24,000. This zone also coincides with the low of August month. Since the index has fallen over 8% in the last four weeks, traders can expect consolidation around 24,000 zone in the upcoming holiday shortened week. However, the index may extend weakness if it surrenders 23,900 level on the daily chart.
F&O – BANK NIFTY outlook
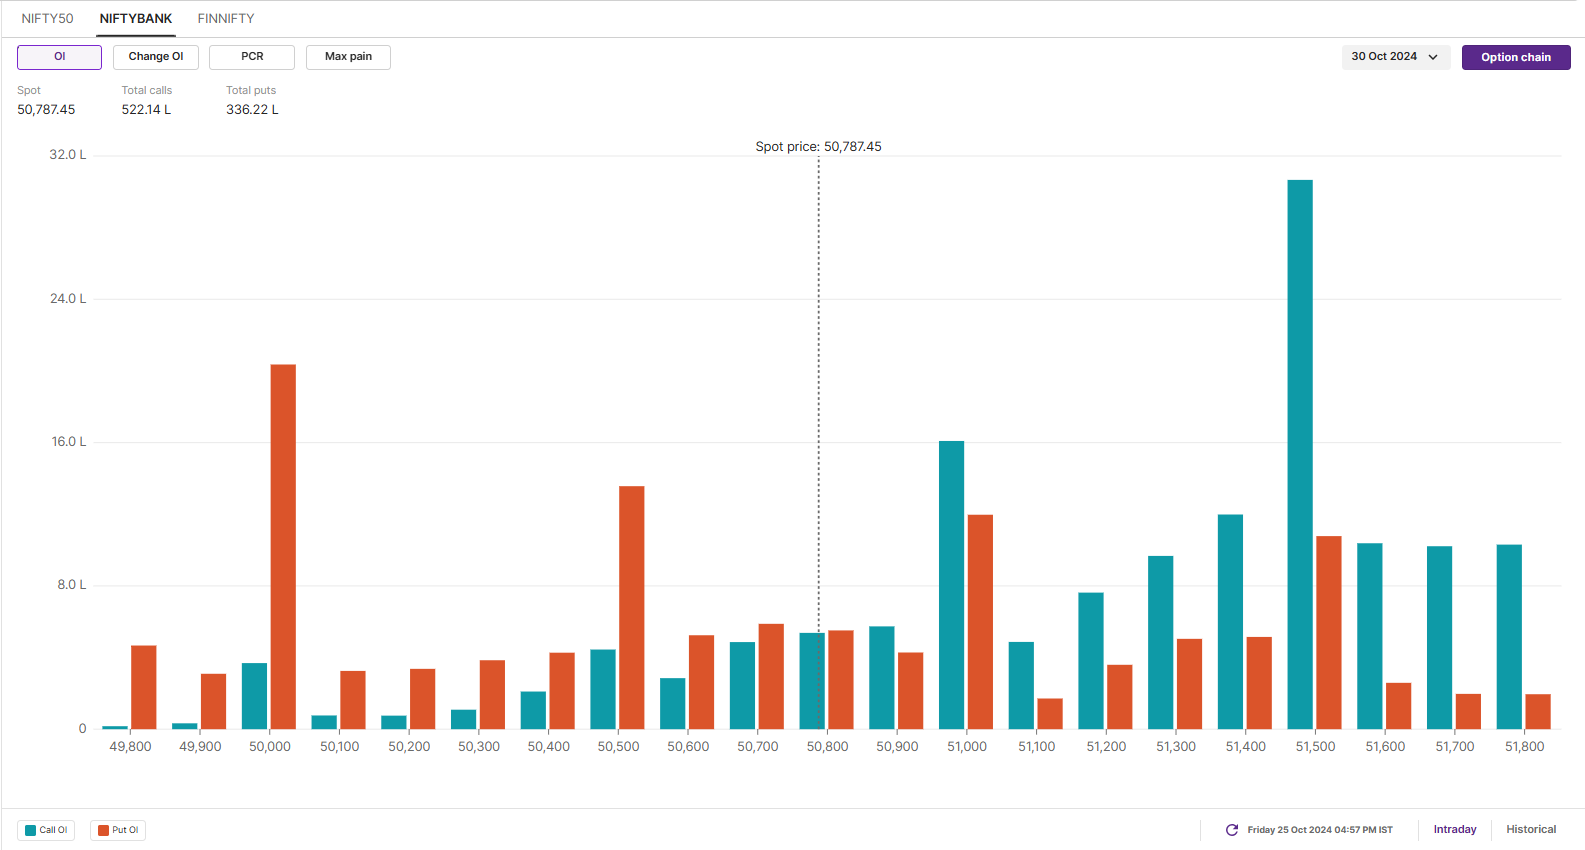
The open interest data of the BANK NIFTY’s monthly expiry saw significant call build-up at 51,500 and 52,000 strikes, indicating resistance for the index around these levels. On the contrary, the put base was seen at 50,000 and 50,500 strikes, suggesting support for the index around these levels.
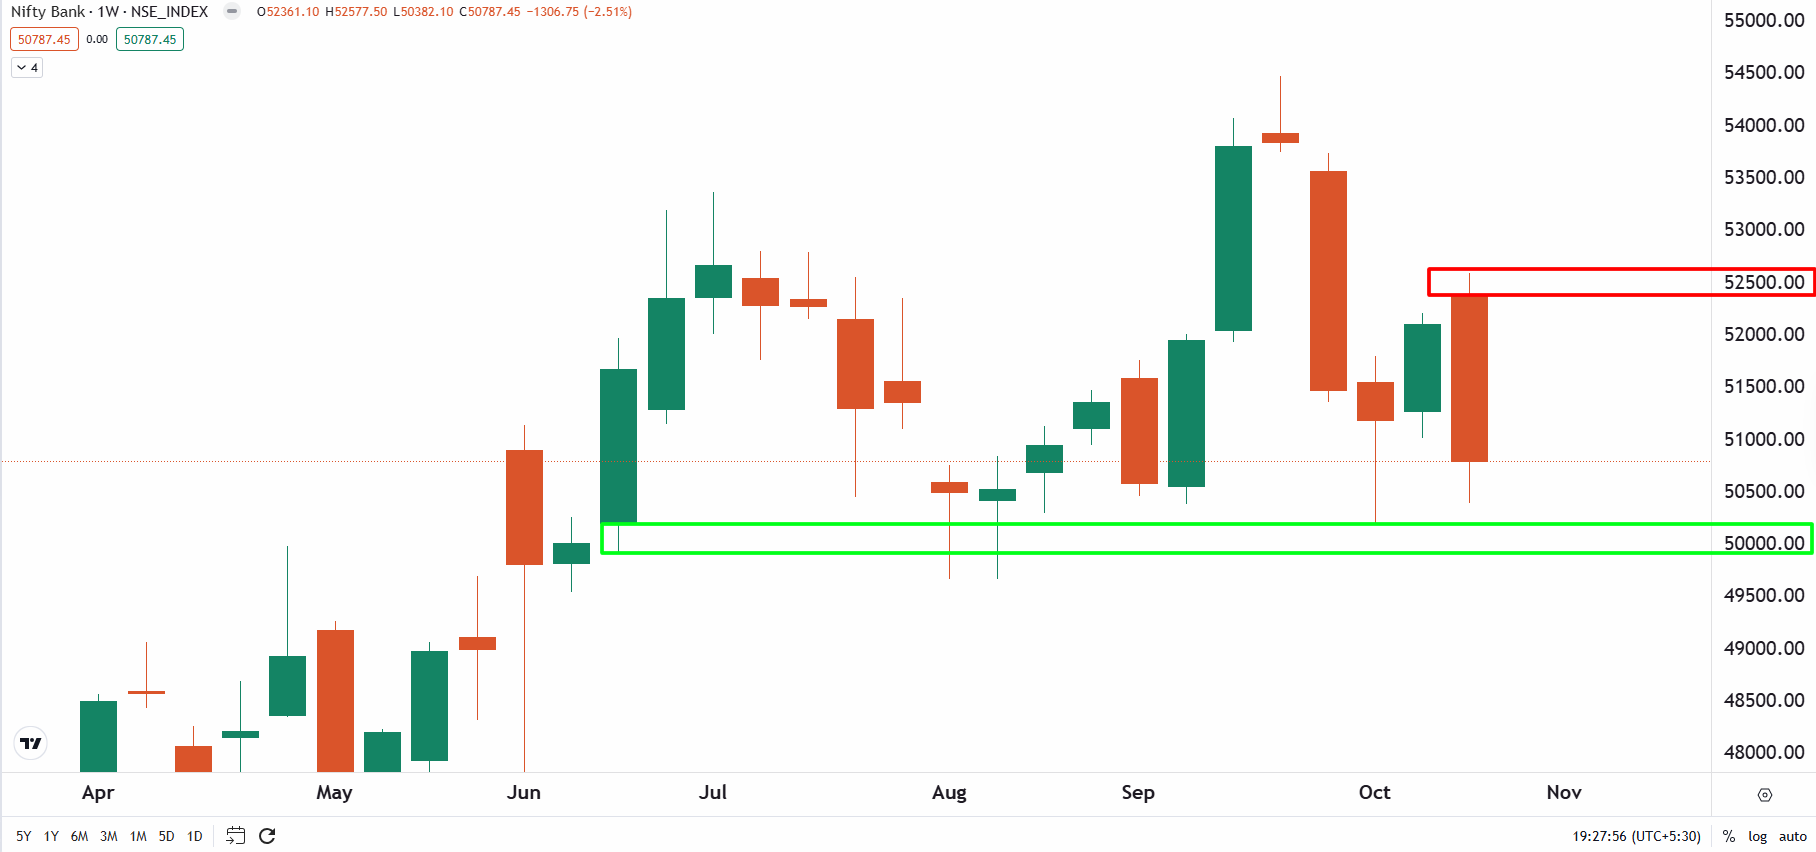
The BANK NIFTY index formed a bearish engulfing on the weekly chart and ended below the low of previous week. However, the bearish reversal pattern will get confirmed if the close of the subsequent candle is below the low of the pattern.
However, as you can see on the chart below, the index managed a small recovery towards the fag end of the session on Friday. The BANK NIFTY protected the low of the hammer candle, formed on the week ending October 11. For the upcoming week, traders can monitor the zone of 50,000 to 50,200. Unless, the index breaks this zone on closing basis on the daily chart, the trend may remain sideways. On the other hand, the immediate reistance for the index is aroun 52,500 zone.
Globally, five companies out of the magnificient seven from the technology space will be declaring the third quarter results. Google, Microsoft, Meta, Apple and Amazon will declare results between Tuesday and Thursday.
📍Mark your calendars: Indian markets will remain closed on 1 November for Diwali. However, the markets will open for one hour between 6 to 7:10 pm for Muhurat trading session.
However, after the steep fall of over 8%, the index is currently sitting at the key support zone of 24,000 to 23,800, which is also the August month low. Unless the index breaks below this zone on a closing basis, the trend could remain sideways.
To stay updated on any changes in these levels and all intraday developments, be sure to check out our daily morning trade setup blog, available before the market opens at 8 am.
Derivatives trading must be done only by traders who fully understand the risks associated with them and strictly apply risk mechanisms like stop-losses. The information is only for consumption by the client, and such material should not be redistributed. We do not recommend any particular stock, securities, or trading strategies. The securities quoted are exemplary and not recommendatory. The stock names mentioned in this article are purely to show how to do analysis. Make your own decision before investing.
Content retrieved from: https://upstox.com/news/market-news/trading/week-ahead-q2-results-fii-outflows-us-tech-stocks-f-and-o-monthly-expiry-among-key-factors-to-watch/article-124980/.